The US black market is the sum of all un-taxed economic activity. Sounds great! Where do I sign up? Right… Well, the catch is that it is illegal. Despite this fact, it is still enormous. This article discusses:
- Economic activities of the black market
- A low-end estimate of the US black market size
- How the white market can compete
- Why this matters
I know that it sounds a bit out there to recommend drug companies should help put the black market out of business, but the situation requires attention.
Black Market Basics
Estimated Size of the US Black Market
How does one estimate the size of the black market? This is certainly a large undertaking. Rather than calculate every part of the black market, I will attempt to provide, at least, a minimum size here.
I have derived a reasonable minimum from a dataset provided publicly by The United States Federal Department of Customs and Border Protection (CBP).
Describing the data
The data used in this analysis documented the month, year, type and weight of drugs confiscated by CBP from January 2020 to June 2023. It was publicly available on their official website. It was downloaded on August, 8 2023. There were 3 months of data (OCT, NOV, DEC) from 2023 that had not yet occurred. These data points were not logical and were removed. The code used to remove this data is shown below.
drugs_past <- drugs %>%
  filter(drugs$FY == "2020" |
         drugs$FY == "2021" |
         drugs$FY == "2022")
drugs_future <- drugs %>%
  filter(drugs$FY == "2023 (FYTD)" &
           drugs$Month..abbv. != "OCT" &
           drugs$Month..abbv. != "NOV" &
           drugs$Month..abbv. != "DEC")
drugs_clean <- rbind(drugs_past, drugs_future) %>%
  mutate("Date" = as.Date(paste0("1",Month..abbv., FY), "%d%B%Y"),
         "Weight" = as.numeric(Sum.Qty..lbs.))
Describing the Analysis
The goal of the analysis was to estimate a lower bound for the US black market size. To do so, two small additions to the data were made. That was to add two new columns. One called “Cost per lb” for each of the drugs. These values were sourced from various sites the web (now the FBI is watching me, all I do for you). The other column was called “Confiscation Total” which was defined as Pounds of Drugs Seized times Cost per lb. Otherwise, how would one calculate total “street” economic activity for a given confiscation? Shown below, is the R code used to make these two additional columns: (1) “Cost per pound” and (2) “Confiscation Total”, for the interested party.
drugs <- read.csv(file = "nationwide-drugs.csv") %>%
  mutate("Cost per lb" = if_else(
    Drug.Type == "Marijuana", 4480, if_else(
    Drug.Type == "Cocaine", 44800, if_else(
    Drug.Type == "Methamphetamine", 35840, if_else(
    Drug.Type == "Lsd", 17500*28*16, if_else(
    Drug.Type == "Fentanyl", 1470*28*16, if_else(
    Drug.Type == "Ecstasy", 150*28*16, 4480)))))),
    "Confiscation Total" = `Cost per lb`*Sum.Qty..lbs.)
Data Exploration
After wrangling in the data, the next step in a data analysis is to explore and understand it. To do so, it was visualized in a number of ways using bar charts. The chart below shows the Weight of Drugs Confiscated by the CBP from 2020 to June, 2023.
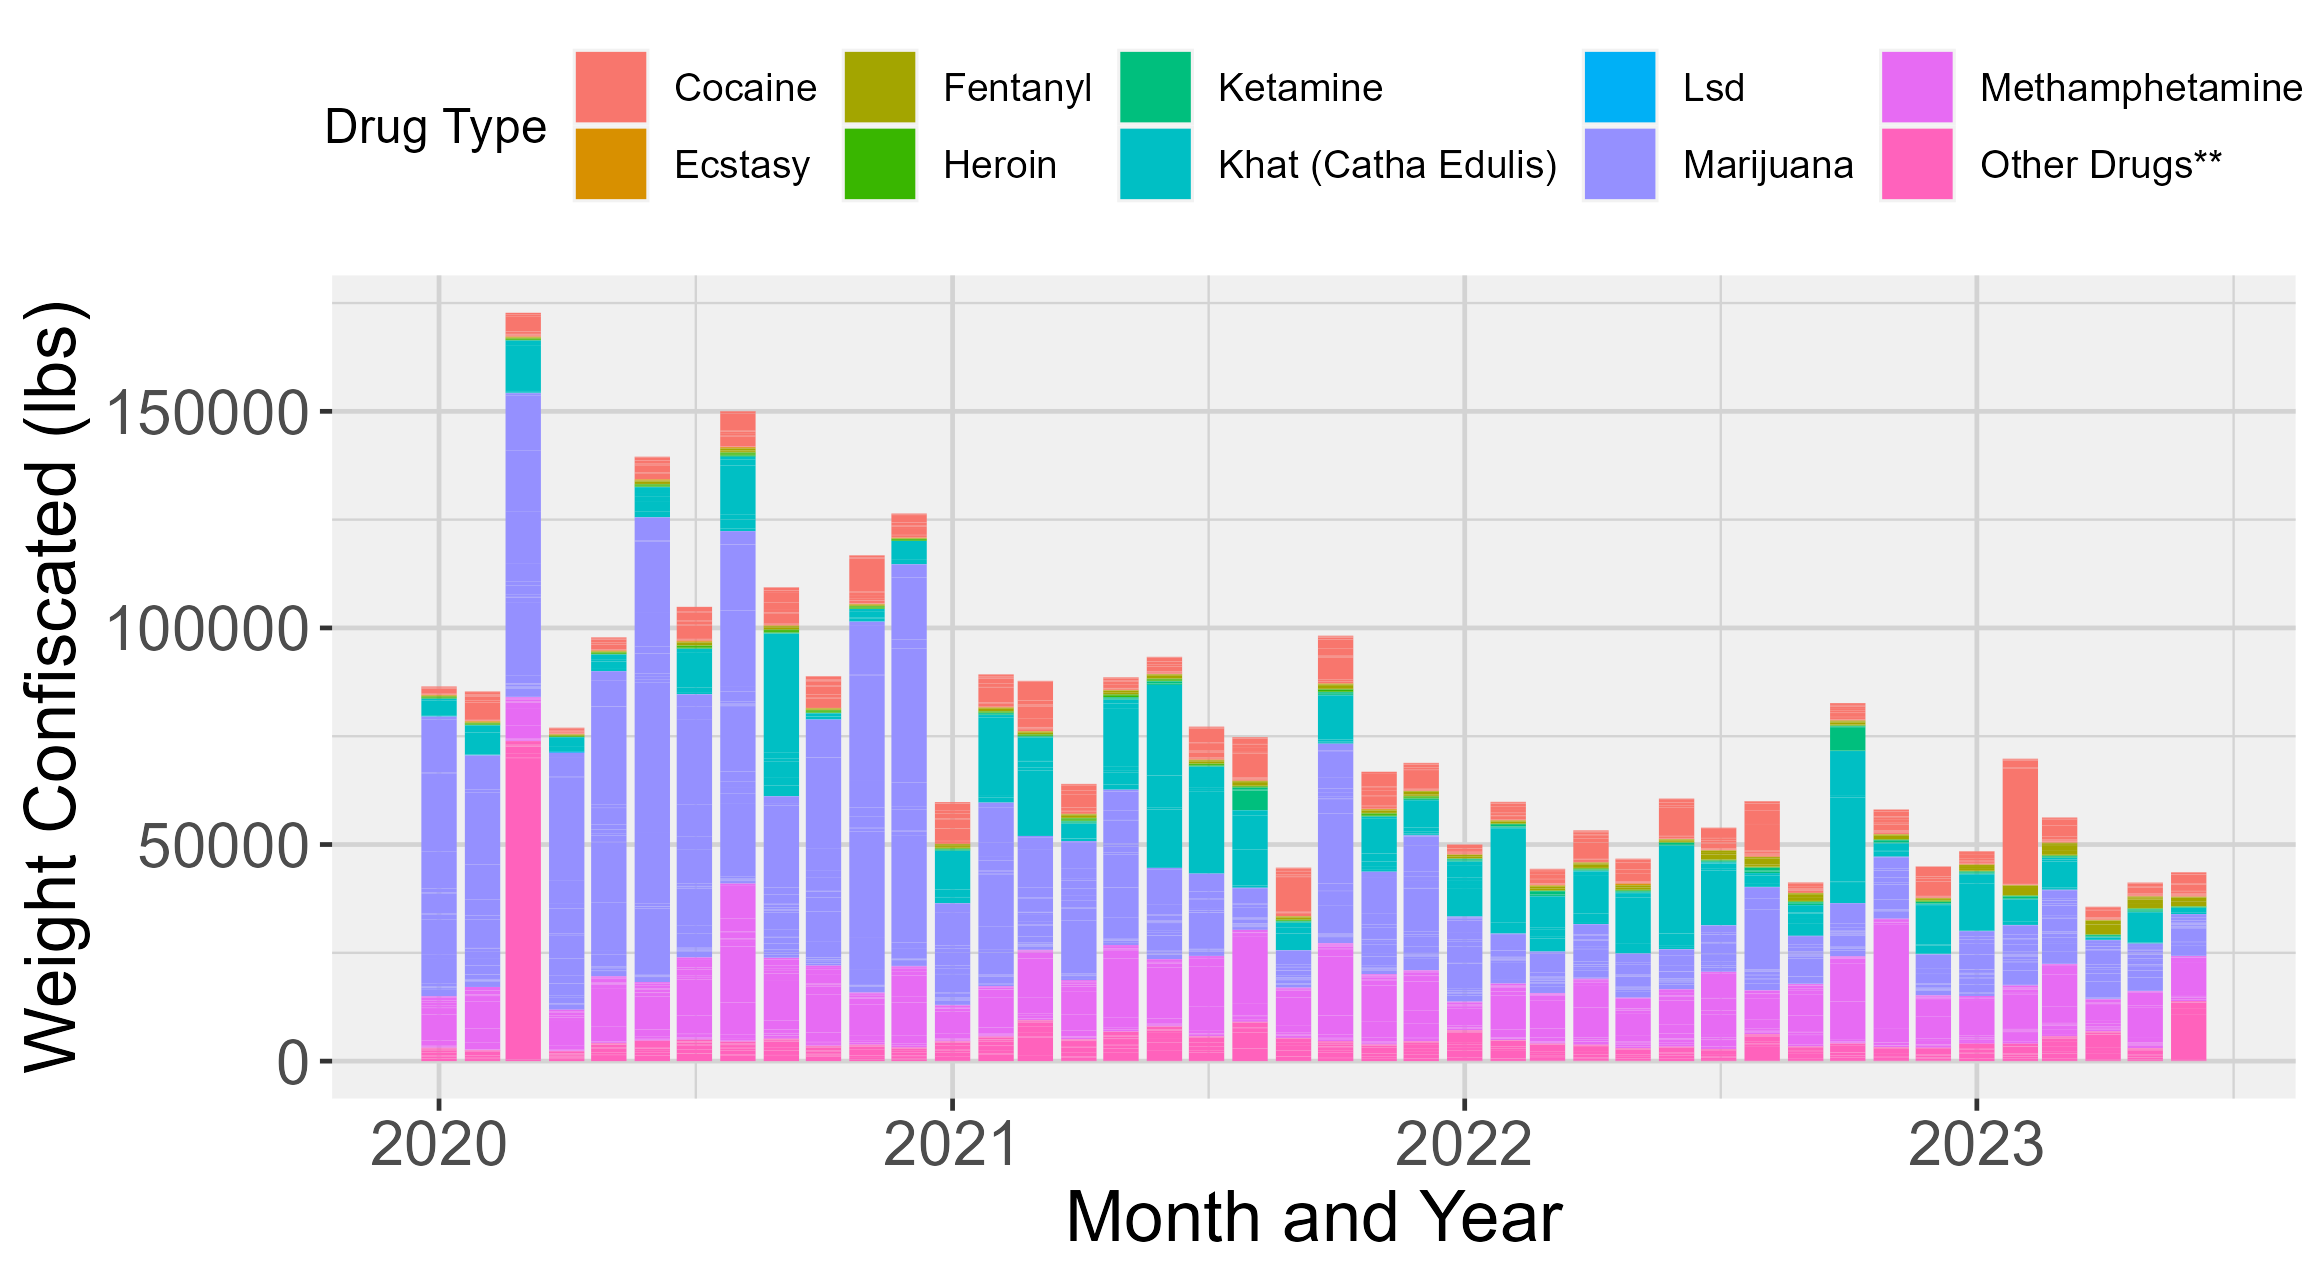
Figure 1: A bar chart showing the weight of drugs (in lbs) confiscated by CBP From 2020 to June, 2023.
From the graph above we can see that the weight of drugs across all categories appeared to be largest in 2020. Let’s look at this same graph, but replace weight with the cost. We are left with the graph below, which shows the “street” value of the drugs plotted across time.
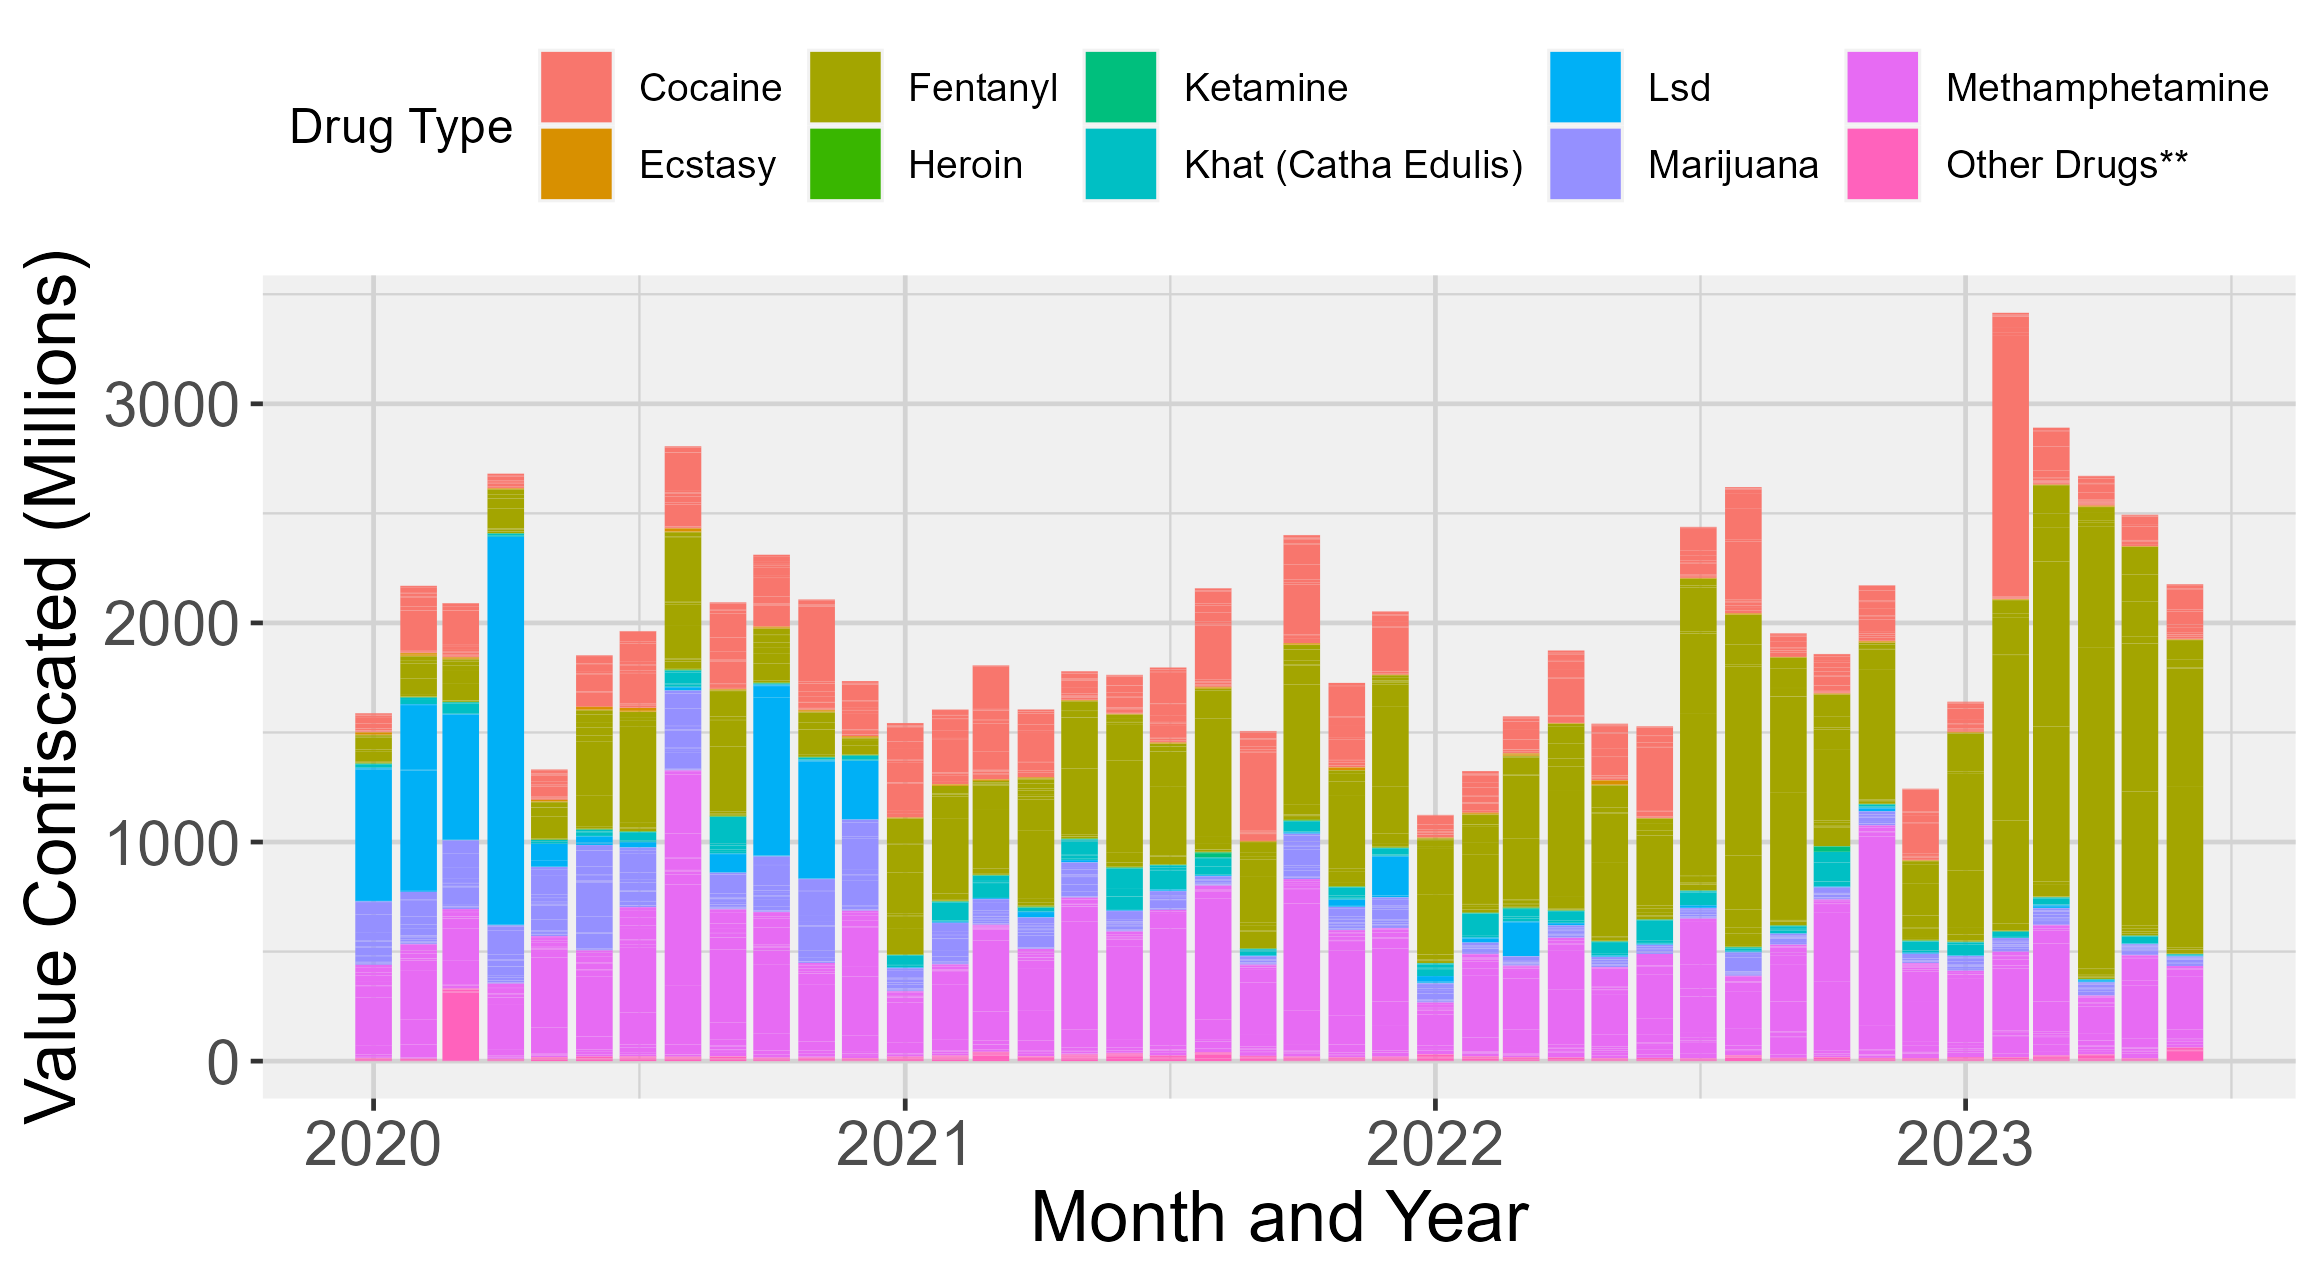
Figure 2: The street value of drugs (in Millions of USD) confiscated by CBP From 2020 to June, 2023.
Interestingly, one can see from the graph above that the value of confiscations may be trending upward this year, 2023. This is further explored in the figure below. There, one can see that the total value of drugs confiscated between 2020 and 2022 ranges between about 20 and 25 billion dollars. Assuming the same amount of drugs are confiscated in the second half of 2023, then we may be approaching 30 billion in value this year.
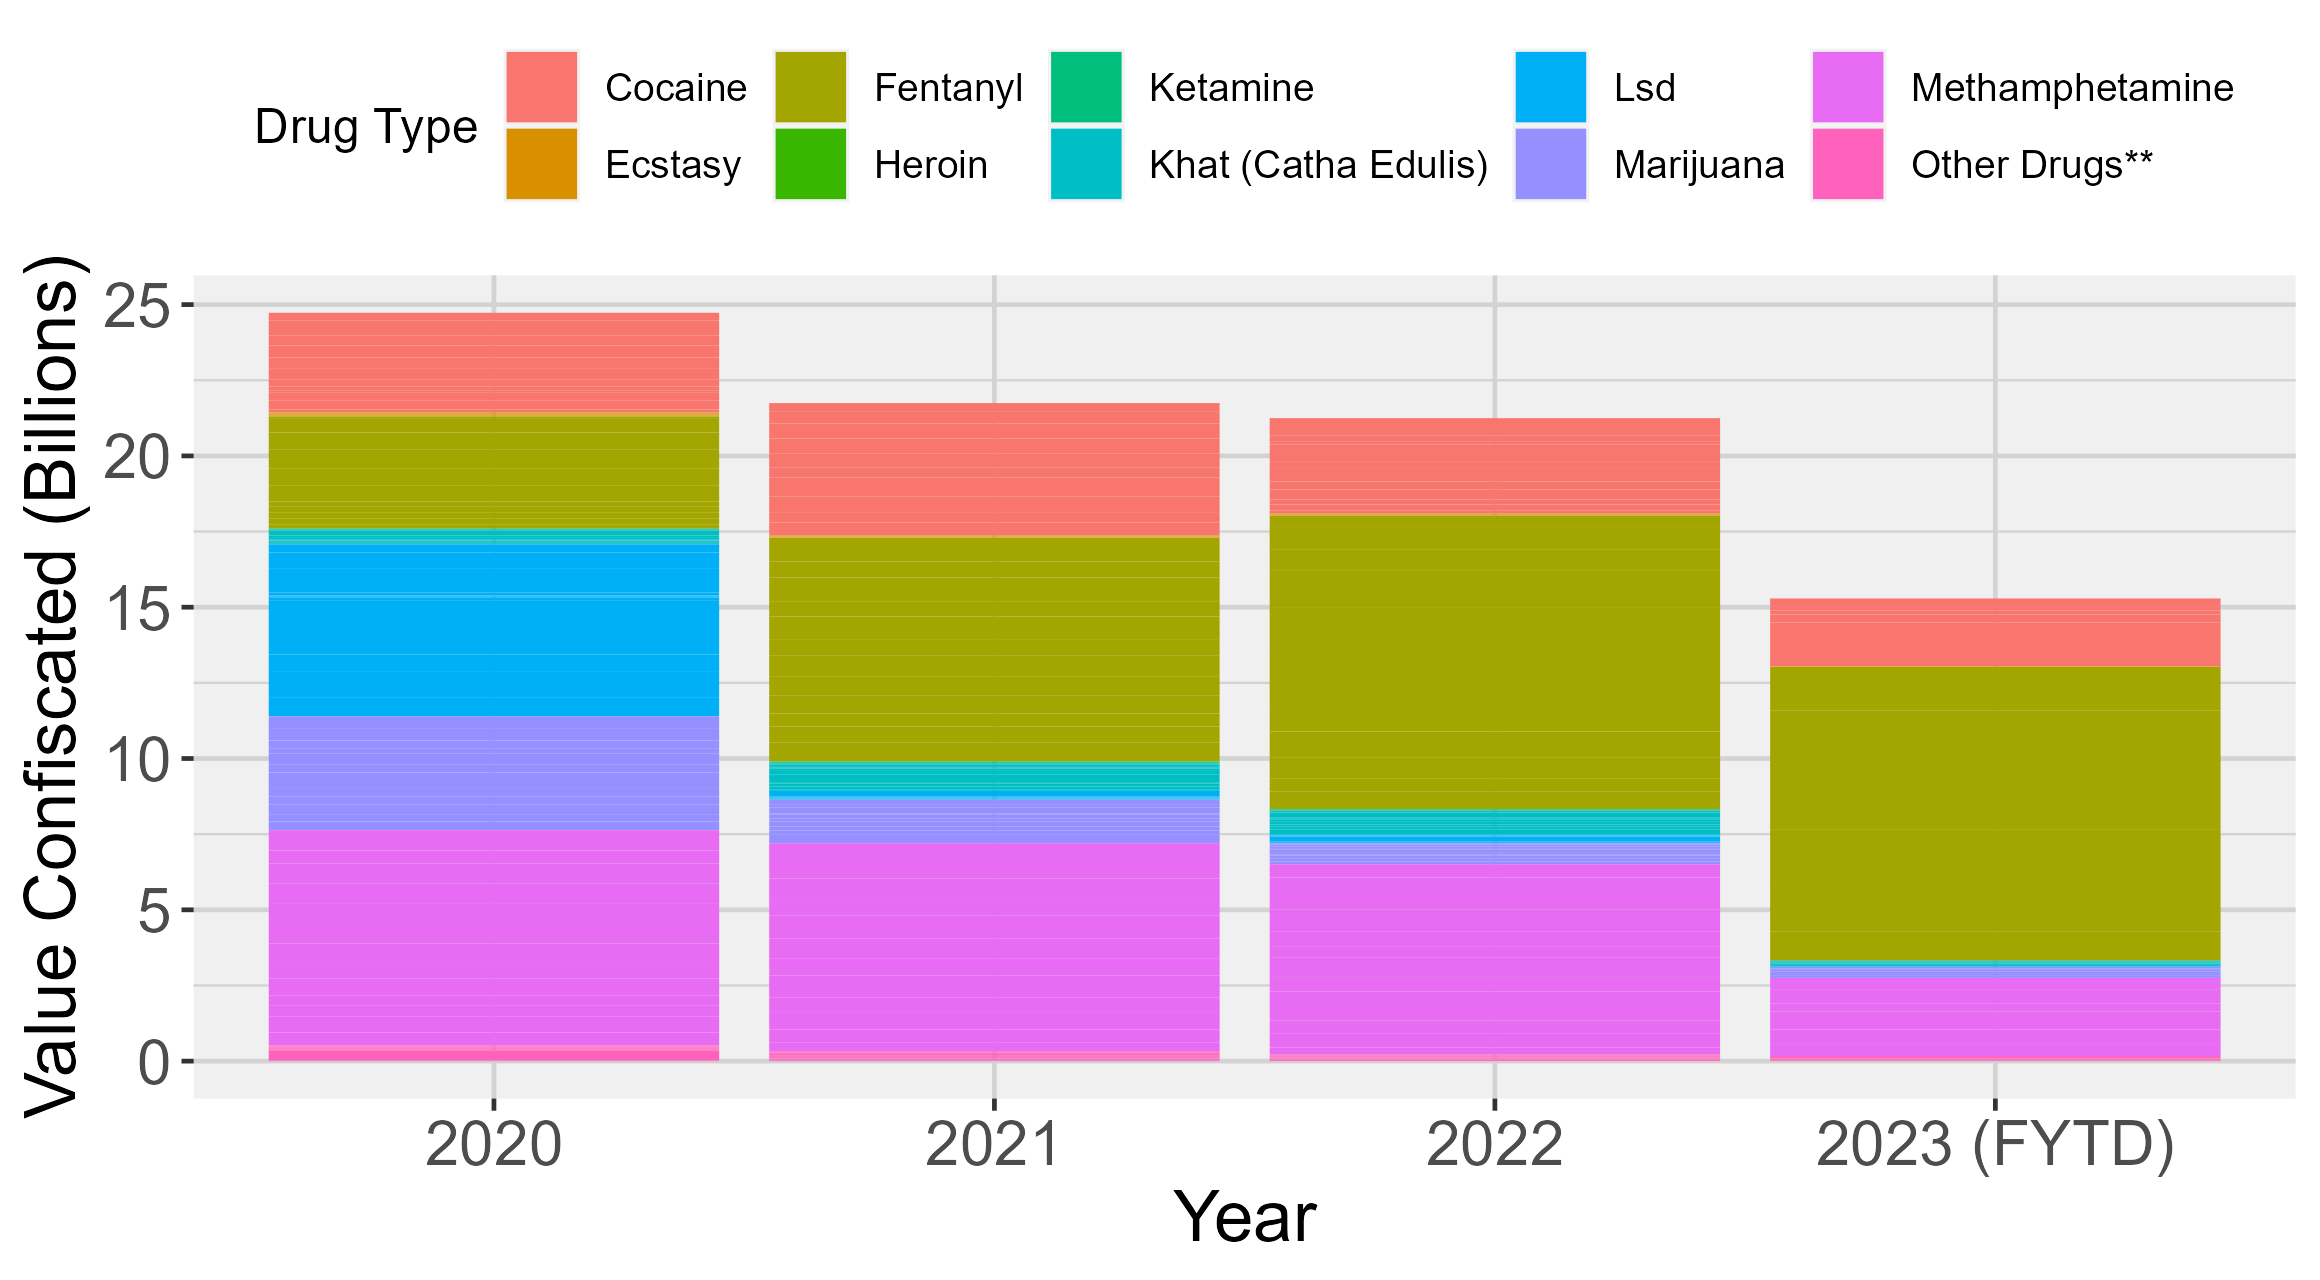
Figure 3: The street value of drugs (in Billions of USD) confiscated by CBP for the years 2020, 2021, 2022, and 2023. Note the 2023 data is through June (half the year).
Statistical Analysis
Below are the results from an ANOVA test, run on the linear model whose coefficients follow, which shows that the Total Street Value of drugs has not changed significantly year over year.
Analysis of Variance Table
Response: Total Street Value
| Df | Sum Sq | Mean Sq | F value | Pr(>F) | |
|---|---|---|---|---|---|
| FY | 3 | 2.8786e+17 | 9.5954e+16 | 2.0858 | 0.1015 |
| Drug Type | 9 | 2.4202e+19 | 2.6891e+18 | 58.4568 | <2e-16 *** |
| Residuals | 407 | 1.8723e+19 | 4.6002e+16 |
The table above shows that Drug Type significantly predicts total seizure value. Looking at the coefficients of the model below, one sees that fentanyl brings the highest estimated value of any drug seized. A value 8.5 times larger than the average, estimated increase from 2020 to 2023 [FY2023 (FYTD) below].
Model Coefficients
(Intercept)                       FY2021                          FY2022
319045864                       -24869022                       -29017447
FY2023 (FYTD)               `Drug Type`Ecstasy             `Drug Type`Fentanyl
48731073                      -302666758                       414320801
`Drug Type`Heroin          `Drug Type`Ketamine  `Drug Type`Khat (Catha Edulis)
-309097750                      -307490976                      -254594574
`Drug Type`Lsd            `Drug Type`Marijuana      `Drug Type`Methamphetamine
-160641662                      -161875497                       233618852
`Drug Type`Other Drugs**
-281232115
Discussion
Although the weight of drugs confiscated by CBP appeared to be decreasing (figure 1), the value of drugs confiscated appeared to be trending normally, or even increasing (Figures 2 and 3). The reason for this appears to be an increase in fentanyl siezures. Fentanyl is an opiate of high potency that has a high cost per lb and an apparently increasing prevalence in the hands of the authorities.
| Year | Value Confiscated (USD Billions) |
|---|---|
| 2020 | 3.69 |
| 2021 | 7.38 |
| 2022 | 9.68 |
| 2023 (YTD, June) | 9.70 |
It would not be unfair to conclude, based on this analysis, that fentanyl seizures are increasing year over year. However, it is still uncertain whether that means there is an increase of fentanyl on the black market. It may be that CBP are focusing more of their efforts on fentanyl as opposed to other drugs, such as lsd, and this is why more fentanyl is being captured.
Assuming the black market is at least equal in value to the amount of drugs seized at the border, the total US black market is, at least, 20-30 billion dollars annually in the US.
Assuming the black market is at least equal in value to the amount of drugs seized at the border, the total US black market is, at least, 20-30 billion dollars annually in the US. Further work must be done to (1) determine an estimate for the percentage of drugs that do not get seized and (2) incorporate other large black market contributors into the estimate, such as: weapons trading, human trafficking, and illegal gambling.
Solutions
The amount of money transacted on the black market is immense, it is at least 20-30 Billion taxable dollars each year. An increasing majority of its size, as of 2021, is due to fentanyl. One can imagine this fentanyl is made cheaply, with low quality control, to make the business worthwhile for traffickers.
One way to decrease black market share and increase white market share is to enable competition. Black market share may not be decreased by simply allowing drugs to be legalized for use. They are still too expensive a liability for domestic, above board providers to provide to those looking to use them. The costs to produce, market and dispense drugs legally is currently prohibitive of competition, leaving room for the crime-riddled black market. If only it were possible to use existing infrastructure of the US pharmaceutical industry to product drugs and reduce the burden on the healthcare professionals prescribing the drugs. One plan goes like this:
- Big pharmaceutical companies can be expanded to produce better, quality controlled products that domestic, non-medical users may purchase
- Through hiring production and quality control staff to meet demand more economic activity will be generated
- Costs must be kept low in order to compete with the black market
- Those purchasing drugs must be of a certain age and consent to all medical legal risks involved
- Educate them on what they are taking and how it affects them
- Offer social programs to users, every time the buy, that provide a real way out of their addiction, including: jobs, housing, better food, social clubs.
I know that it sounds a bit out there to recommend drug companies should help put the black market out of business, but the situation requires attention. I digress, there is more work to be done to further this analysis, but that will come at a later time. For now, let’s discuss why all of this matters.
Why This Matters
It can be reasoned that black transactions reduce inflation because they represent dollars leaving the money supply. However, the money can be laundered in various ways. This article does not discuss money laundering, but there is no denying that it happens. In fact, one may form quite a good estimate of black market size if they were to estimate the amount of money laundered.
That said, this report matters to those looking to assess CBP drug seizures in terms of economic value rather than weight. It helped uncover the upward trend of fentanyl seizures at the border despite the seemingly downward trend in weight of drugs being seized. It is the goal of the author to bring attention to the factually increasing seizure rate of fentanyl. Solutions for what to do about it were lightly discussed. The main takeaway is that there is a large amount of fentanyl being apprehended at the border, and if this is any indicator of how much total volume being trafficked, then we can expect the fentanyl problem to worsen in the immediate future. Call out to your representatives, and show them this analysis. Let it be known that you understand and want solutions for the problem. The fate of many lives depends on it.
Thank you, incredibly, for sticking with me. This is the first report in “Reports” so I wanted to remember it. Thank you CBP for the public data (not an endorsement). God bless you all, and take heart for the battle is won…
About the Author
John Lecocq was riased in Texas, cut his chops in California and currently resides on Floirda’s gulf coast. He enjoys longboarding, being on the water and spending time with friends. Chat with him about anything: math, R programming, engineering, sports, good food and God.