Data Types
Data is an essential to for making decisions. Whether a research scientist is looking to evaluate a new treatment or an entrepreneur is looking to understand their business, both rely on data. Data is stored digitally in a standard form. Some standard forms are csv, tsv, excel. No matter the file type, data is usually organized into dataframes.
Dataframes
A dataframe is composed of columns and rows. Each column records a single characteristic of the data, such as: names, locations, drug types, etc. Rows are where values are stored. The key to a dataframe is that every row corresponds to a single observation. An observation could be a single trial, or in the example below, a single person. This is done so that if one filters for, let’s use the example below, James, then they will be able to view all the data for James.
| Name | Location | Beard |
|---|---|---|
| John | Florida | No |
| James | Texas | Yes |
Scaling up
The example dataframe above is small, but what happens when a dataframe grows large? Big data presents organizational problems. Large data sets take more time to download and icrease strain on a machine during analysis or presentation. Also, human beings look for patterns to create order which are difficult to identify when there is a large amount of information to look through. This is where breaking data up into several different, but related, data sets can be useful.
Using relationships to create order out of chaos
Dividing a data set into several related data sets forms the basis of a relational database. Relational databases are linked together using, what I will refer to as, keys. An example of a key could be a product name. Using product name as a key, one can relate one data set to another when more than one data set contains the same product name.
Simple application of a relational database in industry
Let’s imagine we are the CEO of a medical device company. What are the important metrics? Sales, technical/regulatory information, and production would be a few. All of these metrics pertain to specific products.
Sales data could include the number sold or revenue generated by a product. Technical data could include specifications of the product or its labeling information. Production data could include the number of products manufactured, cost of manufacture and the amount of wasted materials. All three of these data sets could be linked together using the product name key because a single product can be manufactured, marketed and sold.
Using relational databases to categorize data also helps in determining key factors to track. It is easier to determine the factors that describe the sales of an item compared to factors that describe a product generally. Thus, relational databases are not only tools for organization, but are also useful for innovation.
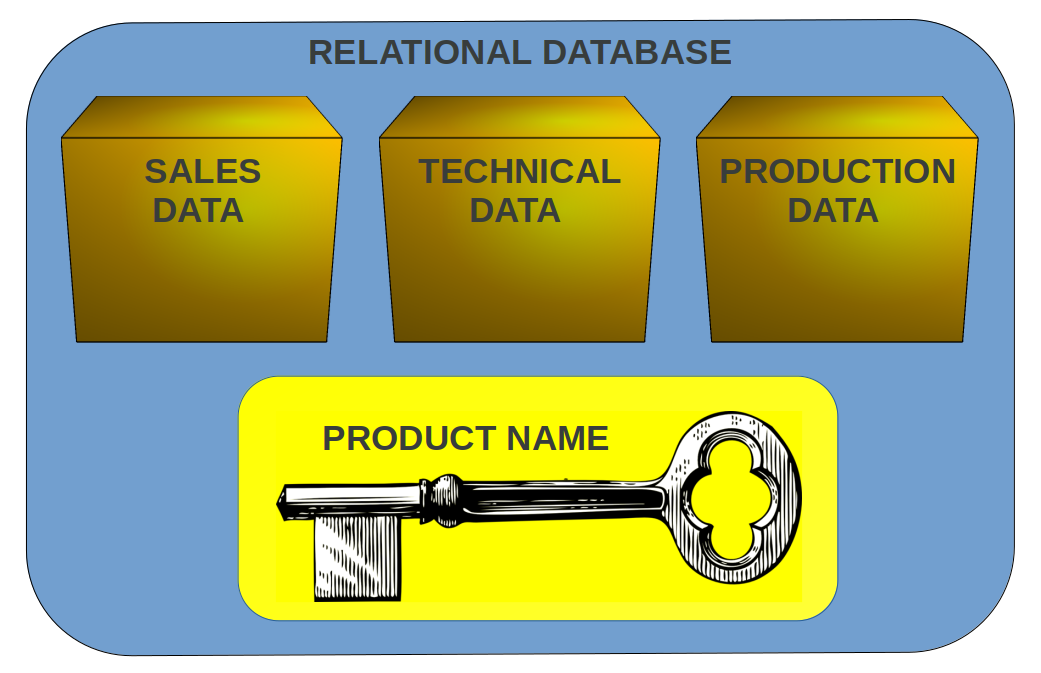
Figure 1: A relational database based on the example given above. The three data sets are linked by the product name key. The same product name can be found in sales data and production data. This can be use, for example, to determine net return on a product before and after a change in manufacturing or sales without having to deal with technical data at all.
Practice
One thing I have learned in my professional career is to start small. Major projects can pay dividends in the long run, but they may take a long time to complete. Starting small combats the burnout that comes with endlessly working on a project without seeing a reward along the way.
Ultimately, a relational database can be quite large (100s of MB to GB) but they do not have to be at first. The relational database discussed above can be created using Microsoft Excel by naming the sheets of the excel file with the categories and entering the relevant variables into each sheet. Hopefully, this post will help people get to thinking about how to create a relational database to organize and build up manageable big data warehouses.
Thank you for reading
About the Author
John Lecocq was riased in Texas, cut his chops in California and currently resides on Floirda’s gulf coast. He enjoys longboarding, being on the water and spending time with friends. Chat with him about anything: math, R programming, engineering, sports, good food and God.