Study Objective
To verify the accuracy of a nutrient calculator application 1.
Procedure
- Look up 10 foods in the USDA’s “What’s In The Foods You Eat Search Tool, 2019-2020” 2
- Look up those same 10 foods in the nutrient calculator
- Document the nutritional content of the foods from both apps
- Visualize results
- Calculate differences
- Evaluate
Results
The raw data (985 unique observations) was read into R 3. The raw data was filtered, using the dplyr package 4, so that only matching nutrients from each app would be compared (536 unique observations). Note, the reason the USDA app contained more nutrients than the app under verification was because the app under verification included only the nutrients with available daily reference intakes. The matching nutrients that were compared are (presented using the knitr package 5):
| Matching Nutrients |
|---|
| Calcium (mg) |
| Carbohydrate (g) |
| Choline, total (mg) |
| Copper (mg) |
| Energy (kcal) |
| Fat, total (g) |
| Fiber, total dietary (g) |
| Folate, total (mcg) |
| Iron (mg) |
| Magnesium (mg) |
| Niacin (mg) |
| Phosphorus (mg) |
| Potassium (mg) |
| Protein (g) |
| Riboflavin (mg) |
| Selenium (mcg) |
| Sodium (mg) |
| Thiamin (mg) |
| Vitamin A, RAE (mcg) |
| Vitamin B-12 (mcg) |
| Vitamin B-6 (mg) |
| Vitamin C (mg) |
| Vitamin D (D2 + D3)(mcg) |
| Vitamin E, alpha tocopherol (mg) |
| Vitamin K (mcg) |
| Water (g) |
| Zinc (mg) |
The tidy data was then transformed, using the tidyr 6 and dplyr packages, into a form that allowed for comparison of nutrient content between the applications by food and by nutrient (249 unique observations). The first 12 observations from this data are shown below:
| description | serving_size | nutrient | usda | app | Absolute Difference | % Difference |
|---|---|---|---|---|---|---|
| Blueberries, frozen | 1 cup (150g) | Calcium (mg) | 12.00 | 12.00 | 0.00 | 0.00% |
| Spinach, raw | 1 cup (25g) | Calcium (mg) | 17.00 | 24.75 | 7.75 | 10.89% |
| Chicken tenders or strips, breaded, from fast food | 300g | Calcium (mg) | 51.00 | 51.00 | 0.00 | 0.00% |
| Milk, whole | 1 cup (244g) | Calcium (mg) | 300.00 | 275.72 | 24.28 | 34.10% |
| Beets, raw | 1 cup | Calcium (mg) | 22.00 | 21.60 | 0.40 | 0.56% |
| Ice cream sandwich | 70g | Calcium (mg) | 73.00 | 60.20 | 12.80 | 17.98% |
| Fish, salmon, baked or broiled | 85g fillet | Calcium (mg) | 9.00 | 12.75 | 3.75 | 5.27% |
| Fish, cod, grilled | 180g | Calcium (mg) | 20.00 | 25.20 | 5.20 | 7.30% |
| Bread, multigrain | 41g | Calcium (mg) | 42.00 | 42.23 | 0.23 | 0.32% |
| Cheese, Cheddar | 132g | Calcium (mg) | 933.00 | 937.20 | 4.20 | 5.90% |
| Blueberries, frozen | 1 cup (150g) | Carbohydrate (g) | 18.26 | 18.26 | 0.00 | 0.00% |
| Spinach, raw | 1 cup (25g) | Carbohydrate (g) | 0.60 | 0.91 | 0.31 | 0.44% |
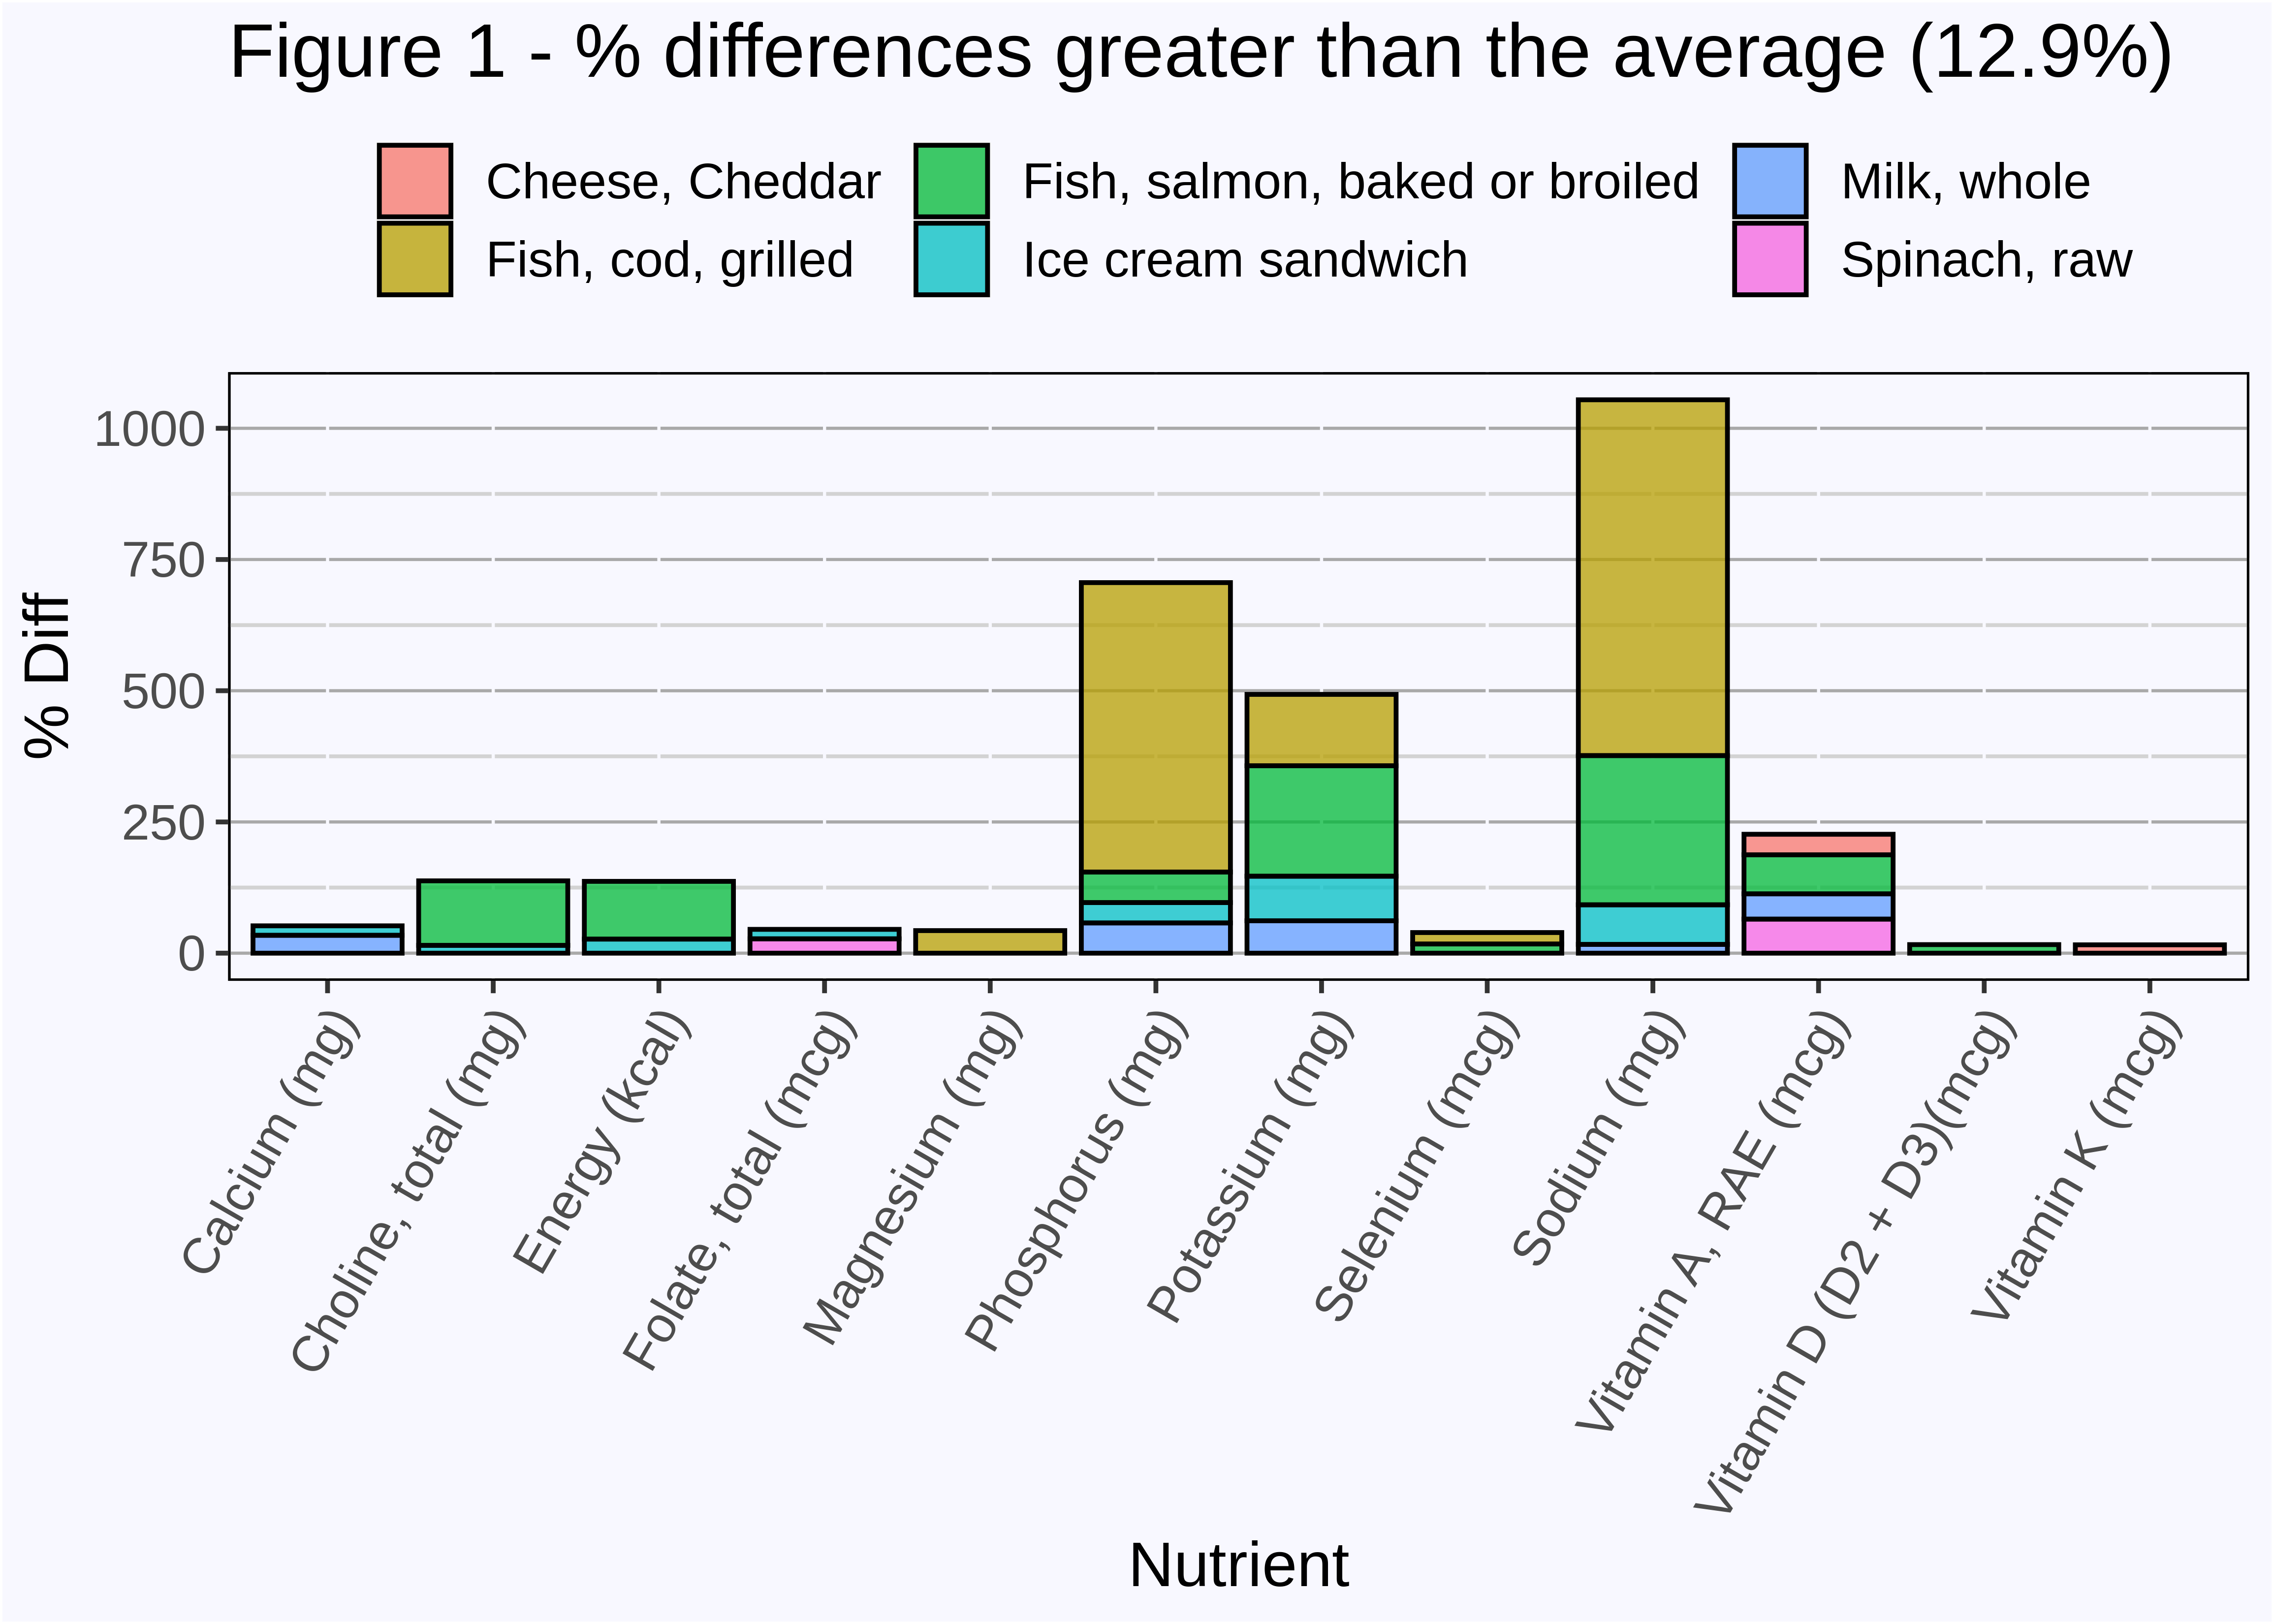
For each food and each nutrient, a percent difference was calculated. Of the 249 observations of by food and by nutrient percent differences, 47 (18.9%) differed by more than 5% and 35 (14%) differed by more than 10%. The average percent difference in the data was 12.9% with a max of 677.8% (the amount of sodium in grilled cod). 29 (11.6%) of the percent differences were greater than the average, as shown below.
Discussion
This app verification contained a large sample of 249 nutrient comparisons. Overall, the difference between the USDA’s Search Tool and the app under verification was reasonably small at 12.9% average percent difference. There were 29 observations with percent differences higher than the mean. Most of these large differences were observed in fish (salmon and cod). If salmon and cod were removed from this study (leaving 199 unique observations) the average percent difference would drop to 3.9%.
The large percent differences in the nutritional content of fish can be explained by two main factors (1) seasonings/additives used and (2) location/habitat of the fish. The reasoning behind the first and second factor comes from figure 1 where one can clearly see large differences for the amounts of sodium, potassium and phosphorus. These atoms are common in seasonings and additives, and it is likely that the same seasonings/additives were not used for both samples.
Conclusion
The app was found to agree with the USDA app 87.1% of the time based on a large sample size of 249 observations. Most of the error in the app was found to be due to large differences found in the nutritional content of the fish included in the study. A likely explanation for this is the presence of seasonings/additives in one sample, but not the other. The observed differences were not systemic i.e. one or more nutrient was not consistently out of balance with the standard set. This study shows that the app, which relies on the USDA’s SR Legacy data, functions in a comparable manner to the USDA’s own app, which functions on the Food and Nutrient Database for Dietary Studies data. Now that comparable accuracy has been determined between the application, a test of speed should be conducted to determine if one application is more time efficient than the other.
Sources
[1] John Lecocq, Nutrient Calculator Application, (Link)[invo.shinyapps.io/nutrientCalculator]
[2] USDA. What’s In The Foods You Eat Search Tool, 2019-2020. https://www.ars.usda.gov/northeast-area/beltsville-md-bhnrc/beltsville-human-nutrition-research-center/food-surveys-research-group/docs/whats-in-the-foods-you-eat-search-tool/
[3] R Core Team (2021). R: A language and environment for statistical computing. R Foundation for Statistical Computing, Vienna, Austria. URL https://www.R-project.org/.
[4] Hadley Wickham, Romain François, Lionel Henry, Kirill Müller and Davis Vaughan (2023). dplyr: A Grammar of Data Manipulation. R package version 1.1.4. https://CRAN.R-project.org/package=dplyr
[5] Xie Y (2023). knitr: A General-Purpose Package for Dynamic Report Generation in R. R package version 1.45, <URL: https://yihui.org/knitr/>.]
[6] Hadley Wickham, Davis Vaughan and Maximilian Girlich (2024). tidyr: Tidy Messy Data. R package version 1.3.1. https://CRAN.R-project.org/package=tidyr
About the Author
John Lecocq was riased in Texas, cut his chops in California and currently resides on Floirda’s gulf coast. He enjoys longboarding, being on the water and spending time with friends. Chat with him about anything: math, R programming, engineering, sports, good food and God.